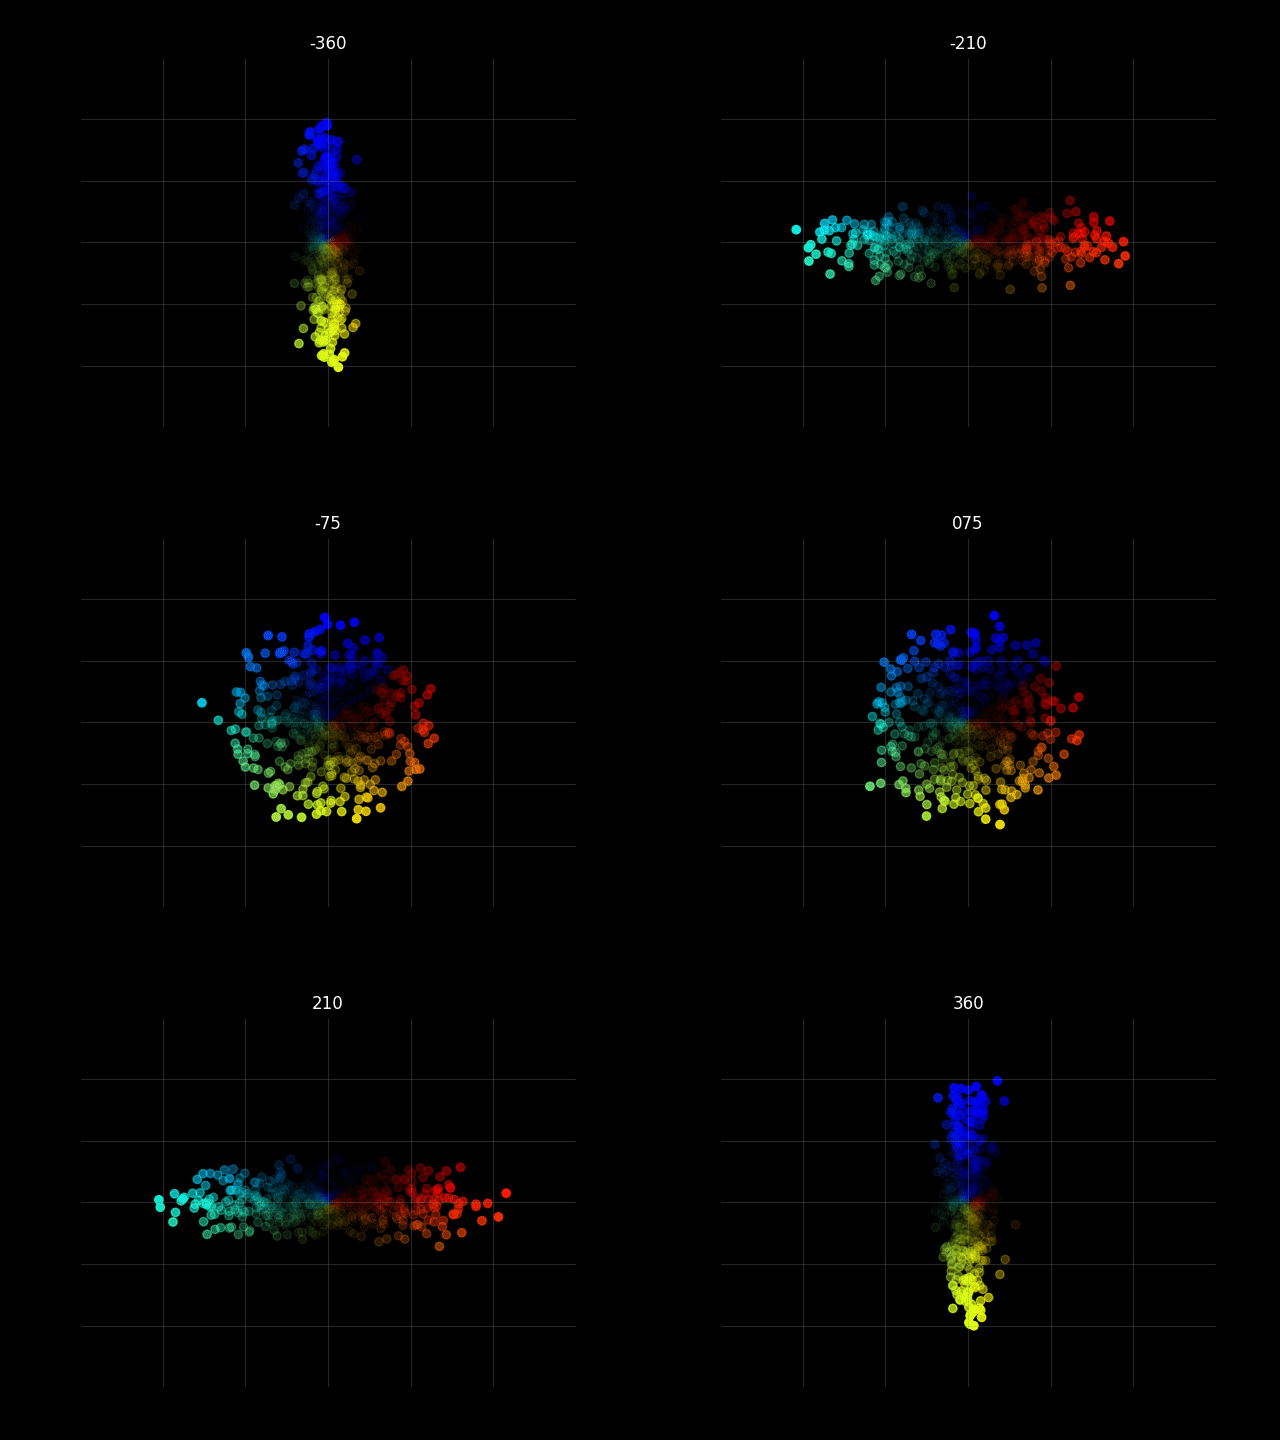
前回の記事では,ステレオのL, R チャネルの信号を,リサージュ図形の として与えることで音の広がりを可視化しました.
この記事では,直交座標 を極座標(絶対値と偏角)
表記にしたバージョンを紹介します.
参考: Goniometer Algorithm - DSP and Plug-in Development Forum - KVR Audio
ただの座標変換であるため,最終的なプロットは直交座標系のものと変わりません。
しかし,絶対値と偏角は振幅の大きさと位相差に対応しているため,振幅の大きさと位相差に応じて色を変える等の高度な描画がやりやすくなります。
実装の流れ
ステレオ信号の直交座標 から絶対値
|z|,偏角\arg z = \thetaを算出します。偏角は主値を(0, 2π]の範囲とするため,直交座標の象限・座標に対応した条件分岐で値を補正します((の値域は(-0.5π, 0.5π)))。
動作確認

ソースコード
プロットの色や透明度の設定については以下の記事をお読みください。 www.wizard-notes.com
# -*- coding: utf-8 -*-
import sys
import numpy as np
import matplotlib.pyplot as plt


sr     = 44100
length = 512
deg    = 0

def make_sig(length, deg, bias=0.0, fo=440):
    offset = np.pi *  deg/ 180
    t      = np.linspace(0, 1.0, length)
    z      = np.linspace(1.0, 0.0, length)
    x = np.c_[
        np.sin(2*np.pi*fo*t) * z          + bias*np.random.normal(0.0, 0.1, length),
        np.sin(2*np.pi*fo*t + offset) * z + bias*np.random.normal(0.0, 0.1, length)
        ].T

    return x


def lissajous(index, xy):
    length = xy.shape[1]
    x, y = xy[0], xy[1]


    magnitude = np.sqrt((x**2 + y**2)* 0.5)
    phase     = np.arctan(y/(x+1e-16))

    for k in range(length):
        # 第2象限 -np.pi/2 < arctan(y/x) < 0
        # 第3象限 0 < arctan(y/x) < np.pi/2
        if (x[k] < 0 and y[k] > 0) \
            or (x[k] < 0 and y[k] < 0):
            phase[k] += np.pi
        # 第4象限 -np.pi/2 < arctan(y/x) < 0
        elif (x[k] > 0 and y[k] < 0):
            phase[k] += 2*np.pi

        # 90度, 270度
        if x[k] == 0:
            phase[k] = np.pi/2 if y[k] > 0 else 3*np.pi/2
        # 0度, 180度
        elif y[k] == 0:
            phase[k] = 0 if x[k] > 0 else np.pi

    phase += np.pi / 4

    x_mod = magnitude*np.cos(phase)
    y_mod = magnitude*np.sin(phase)

    from matplotlib.colors import to_rgb, to_rgba
    cv     = (phase-np.min(phase)) / (np.max(phase)-np.min(phase)+1e-12)
    alphas = (magnitude-np.min(magnitude)) \
                / (np.max(magnitude)-np.min(magnitude)+1e-12)
    cmap = plt.cm.jet
    colors = [None for k in range(length)]
    for k in range(length):
        c_r, c_g, c_b, _ = cmap(cv[k])
        colors[k] = (c_r, c_g, c_b, alphas[k])
        print(colors[k])

    plt.clf()
    plt.scatter(x_mod, y_mod, c=colors, linewidths=1)
    plt.xlim([-1.5, 1.5])
    plt.ylim([-1.5, 1.5])
    plt.title(f"{deg:03}", color="white")
    plt.grid(color="gray", alpha=0.3)
    plt.savefig(f"r{index:03}.png")
    #plt.show()

for k, deg in enumerate(np.arange(-360, 375, 15)):
    sig_LR = make_sig(length, deg, bias=1.0)
    lissajous(k, sig_LR)