折れ線グラフで複数の配列・ラベル・カラーなどの属性をまとめてセットする場合、単純な方法としては以下のように一つの信号 (y_arr) ずつplt.plot()するコードが考えられます。
length = 100
x = np.arange(0, length)
y = np.array([
    np.random.normal(0, 5.0, length),
    np.random.normal(0, 1.0, length),
    np.random.normal(0, 3.0, length),
])
labels = ['foo', 'bar', 'baz']
lines = []

for y_arr, label in zip(y, labels):
    lines.append(plt.plot(x, y_arr, label=label))

plt.legend()
plt.show()
ただ、これだと若干コードが冗長です。
そこで、for文を使わずに複数信号とラベルをまとめてセットする方法を考えてみました。
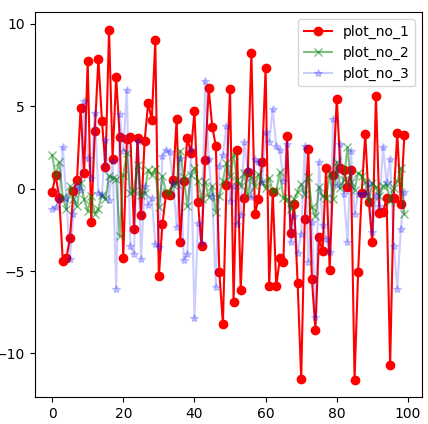
import numpy as np
import matplotlib.pyplot as plt


length = 100
x = np.arange(0, length)
y = np.array([
    np.random.normal(0, 5.0, length),
    np.random.normal(0, 1.0, length),
    np.random.normal(0, 3.0, length),
])
colors = ['r', 'g', 'b']
labels = ['plot_no_1', 'plot_no_2', 'plot_no_3']
markers = ["o", "x", "*"]
alphas = [1.0, 0.5, 0.2]

fig = plt.figure(figsize=(5,5))
ax = fig.add_subplot(111)

ax.set_prop_cycle(color=colors, marker=markers, alpha=alphas)

lines = ax.plot(x, y.T)

plt.legend(lines, labels, loc='upper right')
plt.show()
注意点として、ax.plotに与える2次元配列yの形状は (信号長, 折れ線グラフの数) です。
カラーや透明度などの属性に関しては、ax.set_prop_cycle()を使うことでリストやタプルを使って一気にセットできます。
ただし、ラベルはax.set_prop_cycle(label=labels)とはできません。
各折れ線のラベルに関してはplt.legend(lines, labels)とすることでできます。
前者と比べると、後者のコードは若干見通しがよくなったと思います。