需要が高まってきているバイノーラル処理にチャレンジする場合、まずはWeb上のSOFA形式のHRTFデータで試すことが多いかと思います。
Pythonであれば、SOFA形式のデータ読み込んで Numpy配列にさえ変換すればバイノーラル処理やプロットは容易です。
そこで、今回はPythonでSOFA形式のデータを扱う方法をサンプルコードとともに紹介します。
SOFA 形式について
VRや360°映像における、3次元音響(イマーシブ・オーディオ)を忠実に再現するには、頭部伝達関数(HRTF)やBRIRなどの音響データが不可欠です。
このような音響データは音源の方向や距離,受聴者などの大量に条件ごとに測定をする必要があります。また、測定した室内や機器などの情報もイマーシブ・オーディオのレンダラーには重要な情報となっています。
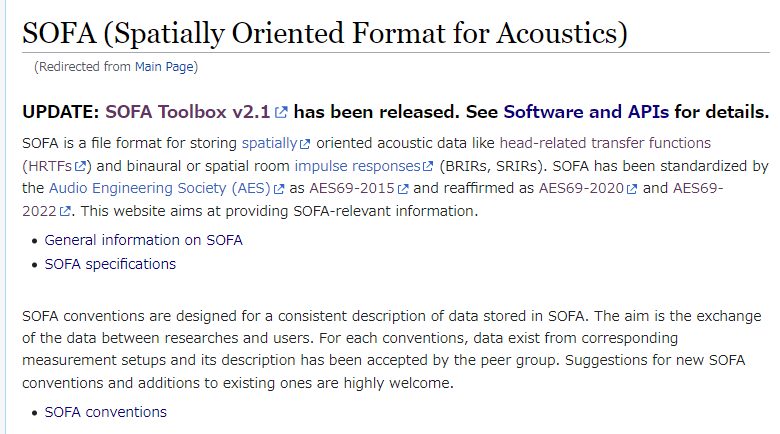
この音響データとメタ情報を共有しやすいように共通のフォーマットとして定義しているのが SOFA (Spatially Oriented Format for Acoustics) になります。
詳しくは、以下のWebサイトをご覧ください。
General information on SOFA - Sofaconventions
SOFAを処理するためのPython用API
SOFA を処理するための各言語向け API が公開されています。
Software and APIs - Sofaconventions
特にPythonでは、以下のようなAPI(モジュール)があります*1。
著者はFIR型データの読み込み用途で pysofaconventions と python-sofa を少しだけ利用したことがあります。
前者はサンプルコードがあるので取っつき易く、とりあえず音響データをNumpy配列として引っ張ってくるだけなら簡単に扱える印象です。ただし、
後者はAPIのドキュメントが用意されておりSOFA形式について知識があれば扱いやすい気がしましたが、サンプルコードが少ないです。
そこで、今回はpysofaconventionsで適当なHRTFデータベースのデータを読み込んでみます。
pysofaconventions を使ってみる
インストール方法
githubに書いてあるように、pipで導入できます。
pip install pysofaconventions
利用するデータベース
以下のWebサイトでは、様々な公開SOFAデータへのリンクがあります。
Files - Sofaconventions https://sound.media.mit.edu/resources/KEMAR/hrtfdoc.txt
今回はこの中から、有名な KEMARダミー ヘッドを使ったMITのデータ(MIT-KEMAR)のmit_kemar_normal_pinna.sofaを利用します。
サンプルコードについて
以下のサンプルコードを改造し、解説用にしました。
pysofaconventions/plotListenHRTF.py at master · andresperezlopez/pysofaconventions · GitHub
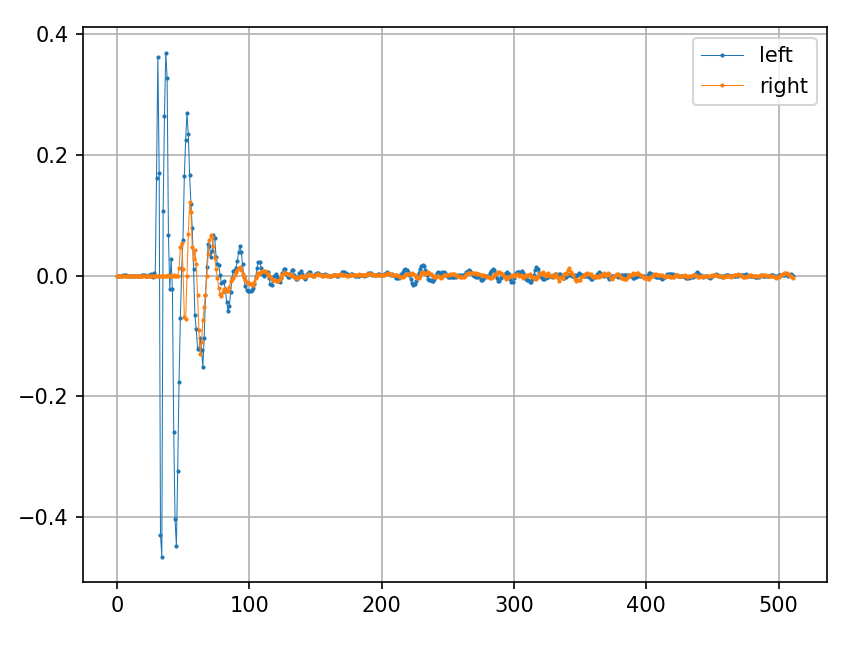
コードの前半では HRTF のインパルス応答となる HRIRを抽出しています。
hrir_allは (音源位置,2,IR長)の3次元配列であり、特定の音源位置から到来する音をシュミレーションするために 方位角60度,仰角30度位置のデータを抽出した2次元配列のhrirを作成しています。
後半では、hrirを任意のモノラル信号に畳み込むことでバイノーラル化しています。
import numpy as np
import pysofaconventions
import matplotlib.pyplot as plt
import scipy.signal
import soundfile as sf


# SOFA形式ファイルを読み込む
sofa_filepath = 'mit_kemar_normal_pinna.sofa'
#  SOFAFileオブジェクトとして読み込まれる
sofa = pysofaconventions.SOFAFile(sofa_filepath, 'r')

# 各オブジェクトの次元(数)に関する情報を標準出力
# - I : 1
# - C : 3
# - Number of receivers (R) : 2 (測定マイク位置。両耳なので2)
# - Number of emitters (E) : 1  (音源位置の数)
# - Number of data samples (N) : 512 (HRTFの長さ(サンプル))
# - Number of measurements (M) : 710 (測定位置の数)
# - S : 0 # (ある場合は)信号源
print("Dimensions:")
sofa.printSOFADimensions()
print("\n")

# 変数
print("Variables")
sofa.printSOFAVariables()
# ListenerPosition = (1, 3)     聴取者の位置
# ReceiverPosition = (2, 3, 1)  マイクロホン位置
# SourcePosition = (710, 3)     音源位置
# EmitterPosition = (1, 3, 1)   音源位置
# ListenerUp = (1, 3)           聴取者の頭の高さ
# ListenerView = (1, 3)         聴取者の向き
# Data.IR = (710, 2, 512)       IRデータのnumpy配列のshape
# Data.SamplingRate = (1,)      サンプリング周波数
# Data.Delay = (1, 2)           遅延
print("\n")

# サンプリング周波数を確認
samplerate_sofa = sofa.getVariableValue('Data.SamplingRate')
print(f"samplerate_sofa: {samplerate_sofa}\n")
# samplerate_sofa: [44100.]


# 測定した音源位置の一覧を取得。
print("Source Positions")
sourcePositions = sofa.getVariableValue('SourcePosition')
# 2次元配列(masked_array)で、音源位置ごとの方位角・仰俯角・距離情報を表している
print(sofa.getPositionVariableInfo('SourcePosition'))
print(sourcePositions)
# 例:方位角が 0 (正面)のインデックスとデータを抽出
center_indices = np.where(sourcePositions[:,0]==0)
print(center_indices)
print(sourcePositions[center_indices])
print("\n")
"""
>>> print(center_indices)
(array([  0,  56, 116, 188, 260, 332, 404, 476, 536, 592, 637, 673, 697,
       709], dtype=int64),)
>>> print(sourcePositions[center_indices])
[[  0.  -40.    1.4]
 [  0.  -30.    1.4]
 [  0.  -20.    1.4]
 [  0.  -10.    1.4]
 [  0.    0.    1.4]
 [  0.   10.    1.4]
 [  0.   20.    1.4]
 [  0.   30.    1.4]
 [  0.   40.    1.4]
 [  0.   50.    1.4]
 [  0.   60.    1.4]
 [  0.   70.    1.4]
 [  0.   80.    1.4]
 [  0.   90.    1.4]]
"""
# HRIR (インパルス応答)を抽出
hrir_all = sofa.getDataIR().data #masked_arrayなので、dataを抜き出す
print(hrir_all.shape)
print("\n")
# (710, 2, 512)

# 方位角60度,仰角30度のIRデータを抜き出す
index = np.where(np.logical_and(sourcePositions[:,0]==60, sourcePositions[:,1] == 30, sourcePositions[:,2] == 1.4))[0]
print(index)
print(sourcePositions[index].data[0])
# array([486], dtype=int64)
# array([ 60. , 30. ,  1.4])
hrir = np.squeeze(hrir_all[index])
print(hrir.shape)
# (2, 512)

# プロット
plt.plot(hrir[0], label="left", linewidth=0.5,  marker='o', markersize=1)
plt.plot(hrir[1], label="right", linewidth=0.5,  marker='o', markersize=1)
plt.grid()
plt.legend()
plt.show()


# モノラル信号にHRIRを畳みこむ。
audio_filepath = "chirp.wav"
x_mono, samplerate_x = sf.read(audio_filepath)
if samplerate_x != samplerate_sofa:
    print("Error: samplerate mismatch")
    exit(1)

# Convolve it with the hrir
x_binaural_left  = scipy.signal.fftconvolve(x_mono, hrir[0])
x_binaural_right = scipy.signal.fftconvolve(x_mono, hrir[1])
x_binaural = np.asarray([x_binaural_left, x_binaural_right]).swapaxes(-1,0)

# save
sf.write('binaural.wav', x_binaural, samplerate_x)
関連リンク
- SOFA (Spatially Oriented Format for Acoustics) - Sofaconventions
- Two!Ears documentation — The Two!Ears Auditory Model <unknown> documentation
- バイノーラル再生とSOFAがもたらす未来 - MUSIC EcoSystems | BIZ
- 頭部伝達関数による音像定位 ——個人化へ向けたデータ群と課題—— 岩谷幸雄
- AES Standard » AES69-2022: AES standard for file exchange - Spatial acoustic data file format
*1:2023年4月現在,著者が見つけられたもののみ掲載