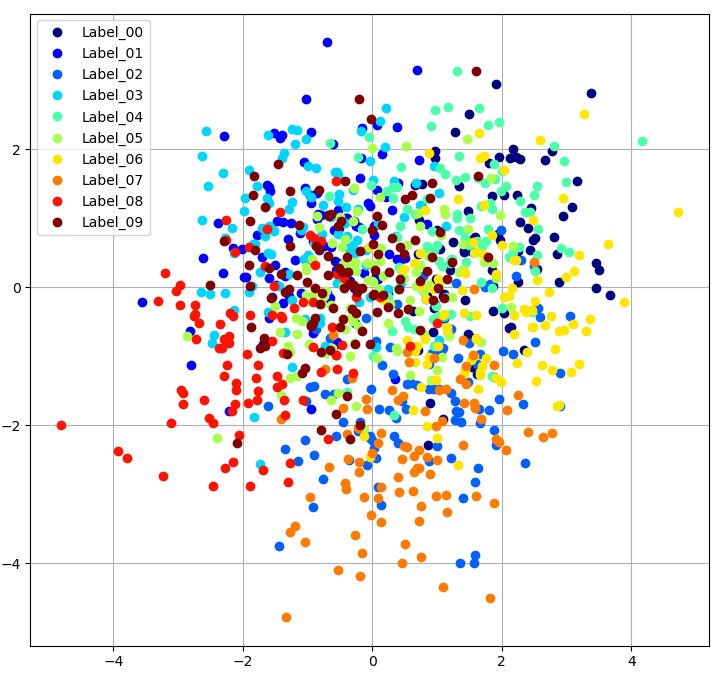
ラベリングされた2次元のデータを、各ラベルごとに色を分けてプロットします。
今回はCSV/TSVを想定したトイデータとして、各サンプルごとにラベル文字列が入ったデータを扱っています。numpy.uniqueを使うことで、ラベル文字列のリストを生成しています。
import numpy as np
import pandas as pd
import matplotlib.pyplot as plt

cmap_keyword = "jet"
cmap = plt.get_cmap(cmap_keyword)

n_labels = 10
n_samples = 1000

# Make toydata
# label
label_list = [f"Label_{k:0=2}" for k in range(0, n_labels)]
tmp = np.random.randint(n_labels, size=n_samples)
labels = np.array([label_list[tmp[k]] for k in range(0, n_samples)] )

# x
np.random.seed(0)
x = np.zeros((2, n_samples))
for idx, label in enumerate(np.unique(labels)):
    n_tmp = len(labels[labels==label])
    mean = np.random.normal(0.0, 1.0, 2)
    cov = np.array([[1.0, 0.25],[0.25, 1.0]])
    x[:, labels==label] +=  np.random.multivariate_normal(mean, cov, n_tmp).T

# Plot
fig, ax = plt.subplots(figsize=(10,8))
for idx, label in enumerate(np.unique(labels)):
    indices = np.where(labels == label)[0]
    c = cmap(idx/(n_labels-1))
    ax.plot(x[0, indices], x[1, indices], 'bo', color=c, label=label)

ax.legend(loc="upper left")
plt.grid()
plt.show()


import code
console = code.InteractiveConsole(locals=locals())
console.interact()